3 min read
TAKE A BREAK
Ethereum Re-Enters 2022 Price Range: Are We Facing Years of Sideways Movement?
Updated: 4/11/2025
Ethereum Breaks Down Into Old Territory
The re-entry into the 2022 range signals structural weakness
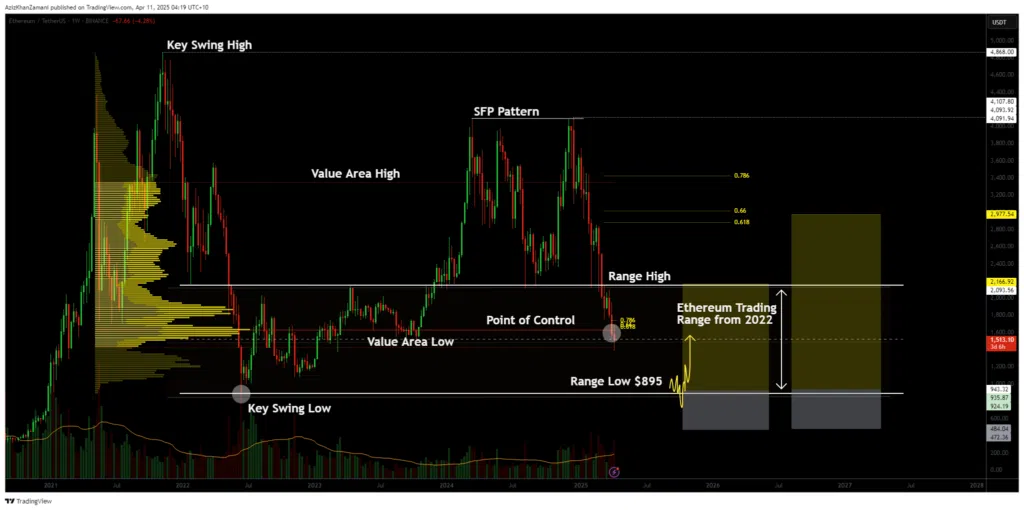
After briefly breaking out of its long-standing $1,000–$2,000 range, Ethereum has now slipped back into that same zone. The move is not just psychological—it suggests the bullish breakout has failed, and the asset may remain trapped in this bandwidth for an extended period.
Historically, when Ethereum has returned to such a well-defined range, it tends to consolidate for long periods, sometimes over a year, before any significant directional change. Recent bearish candles confirm the market’s re-acceptance of this range.
Market Structure and Technical Levels
Support zones and key volume nodes under pressure
Ethereum is currently hovering around the point of control—the price level within this range where the most trading volume has occurred. Losing this level would shift momentum toward the value area low, typically seen as the last line of defense for bulls.
Should Ethereum break below that area, there’s little left structurally to prevent a retest of the $1,000 mark, the bottom of the 2022 bear market. This zone held as support during past capitulation events, and a failure here could reset long-term sentiment.
The Bearish Macro Context
Downtrend persists as bullish momentum fades
Despite some optimistic forecasts, Ethereum has failed to maintain upward pressure in 2025. Multiple weekly bearish engulfing patterns have developed, reinforcing the macro downtrend.
This technical rejection aligns with broader economic anxiety, especially as U.S. equities decline and crypto faces headwinds from regulatory uncertainty and geopolitical instability.
Investor Strategy Going Forward
Accumulation opportunity or prolonged stagnation?
For long-term investors, Ethereum’s return to the lower part of this range may offer accumulation opportunities, especially for those who believe in ETH’s long-term utility. However, patience will be critical.
Unless Ethereum regains momentum and reclaims range highs with conviction, any rallies are likely to be sold into. A true bullish reversal will require a strong structural change—something not currently present in the charts.
What to Watch Next
Volume, support zones, and potential catalysts
- Point of Control (~$1,700): Must hold for bullish case to stay alive
- Value Area Low (~$1,300): Below this, risk of capitulation increases
- Range Low (~$1,000): Last major support before retesting bear market lows
Traders should monitor volume around these areas. A breakdown on rising volume could confirm the start of a deeper correction, while low-volume consolidation may indicate indecision and further stagnation.